Hello,
I’m trying to move my graph in time. (like a circular buffer which save a data and delete another)
I didn’t find how to do it with the widgets and in the forum. But it seems possible !
( https://ubidots.com/docs/images/gif/intro_dashboard.gif )
Thanks for your answer !
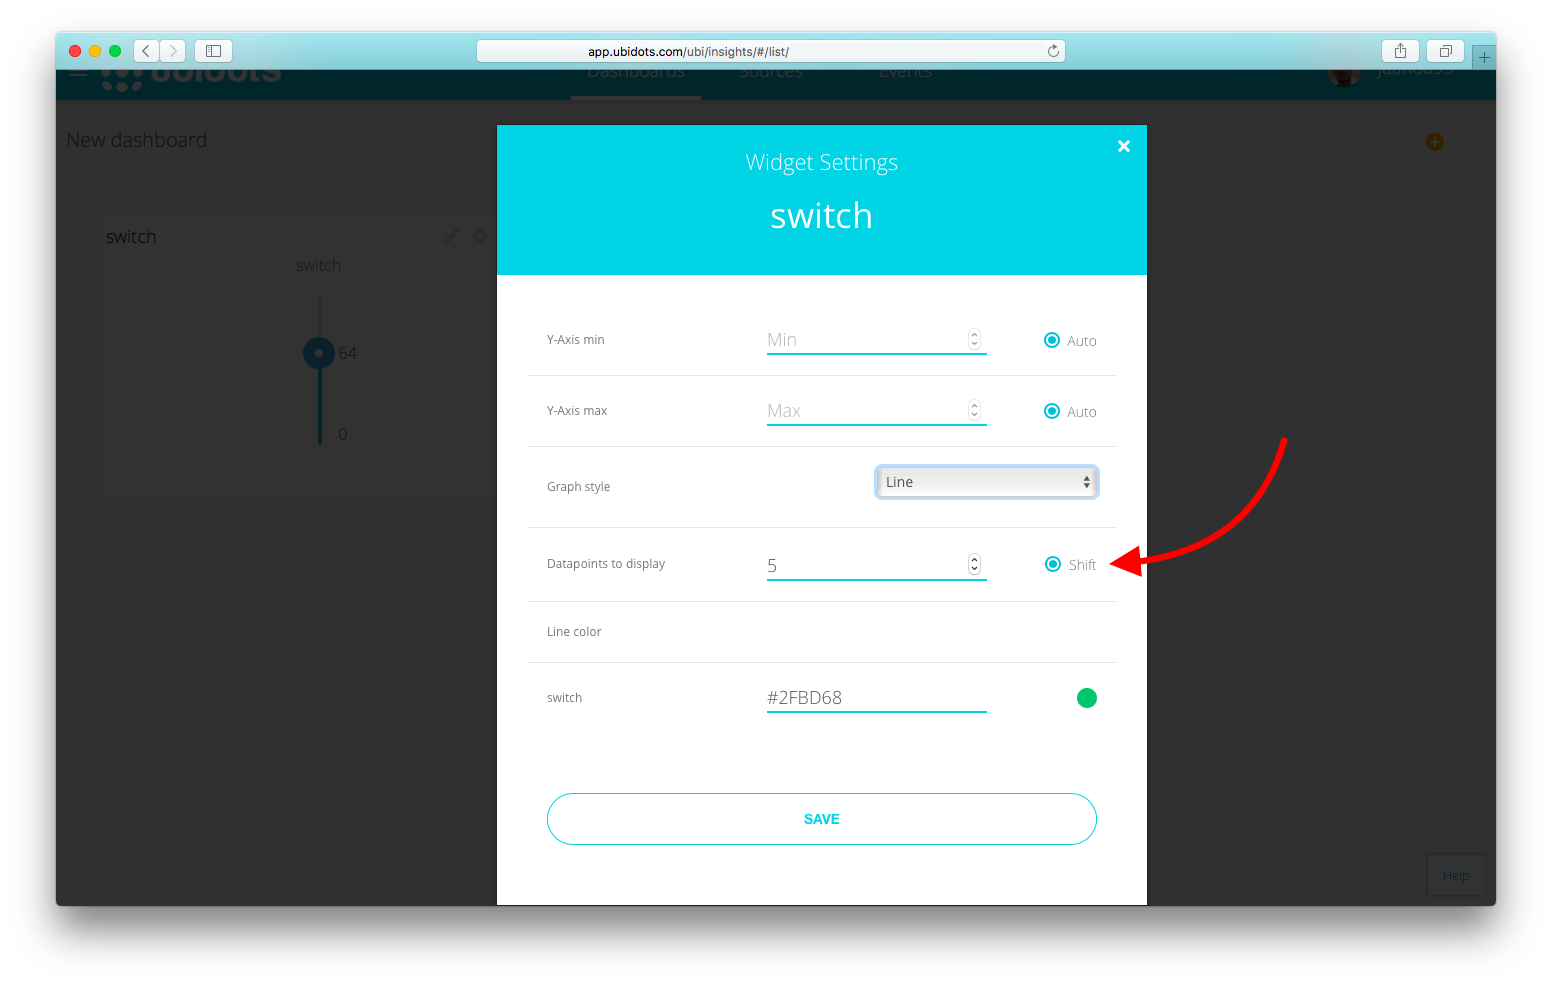
Hi @johhny210, that’s a line chart with the “Shift” setting activated and is receiving data and showing it in realtime.
That’s the setting you should have activated in order to visualize your chart like that. Oh! And look at the “Datapoints to display”, you must have reached the limit you have there in order for the past values to start being clear from the line chart. That’s why I just have my chart to show me the last 5 values instead of the 500 by default.
Hope this helps!
1 Like
Yay! I’m glad that helped you.
Hope you enjoy using Ubidots!
Hi guys,
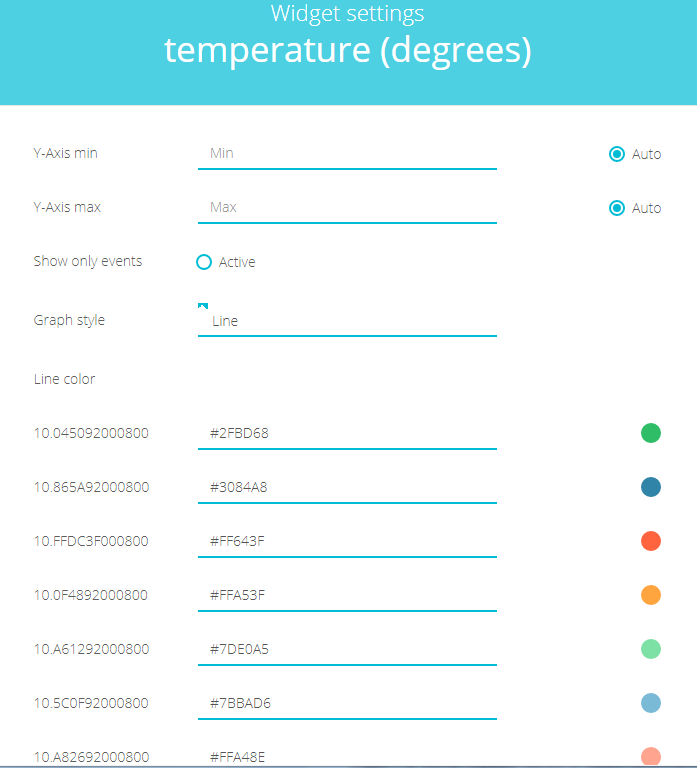
I know it’s an old post but my issue is that even though I selected “line chart” I do not see the “shift” setting at all. What am I missing?
Thanks