Leaving any dashboards open in either IE or Chrome (No others to test) with a line chart (At least I think this is the cause) will eventually crash the browser or cause a memory error. If you look at Task Manager you can actually see memory use increasing over time.
This was reported back in December 2014 and a fix ensued.
Seems like we have the problem again. Some of my dashboards will require displaying on large screens 24/7 so this kills any planned projects with Ubidots.
Regards
Hi @mantracourt, thanks for your report. Indeed, this was fixed a while ago. Do you have other widgets in the dashboard? We are looking into it right now.
Replied to email with public URL of dashboard.
Even this simple dashboard with one line chart will crash the browser after a few hours. Testing in Chrome is good as that will display the error type. (Chrome ran out of memory)
http://cloud.mantracourt.net/ubi/public/getdashboard/page/wd1um6REUa204l-2uAsYqhW6oN4
Thank you
Hello @mantracourt
I left the Dashboard open for 1 hour in my computer and after some patches we made seems to be working better. It’s still a priority for us to study the performance of the widgets when open for a longer time and the next week should be fixed.
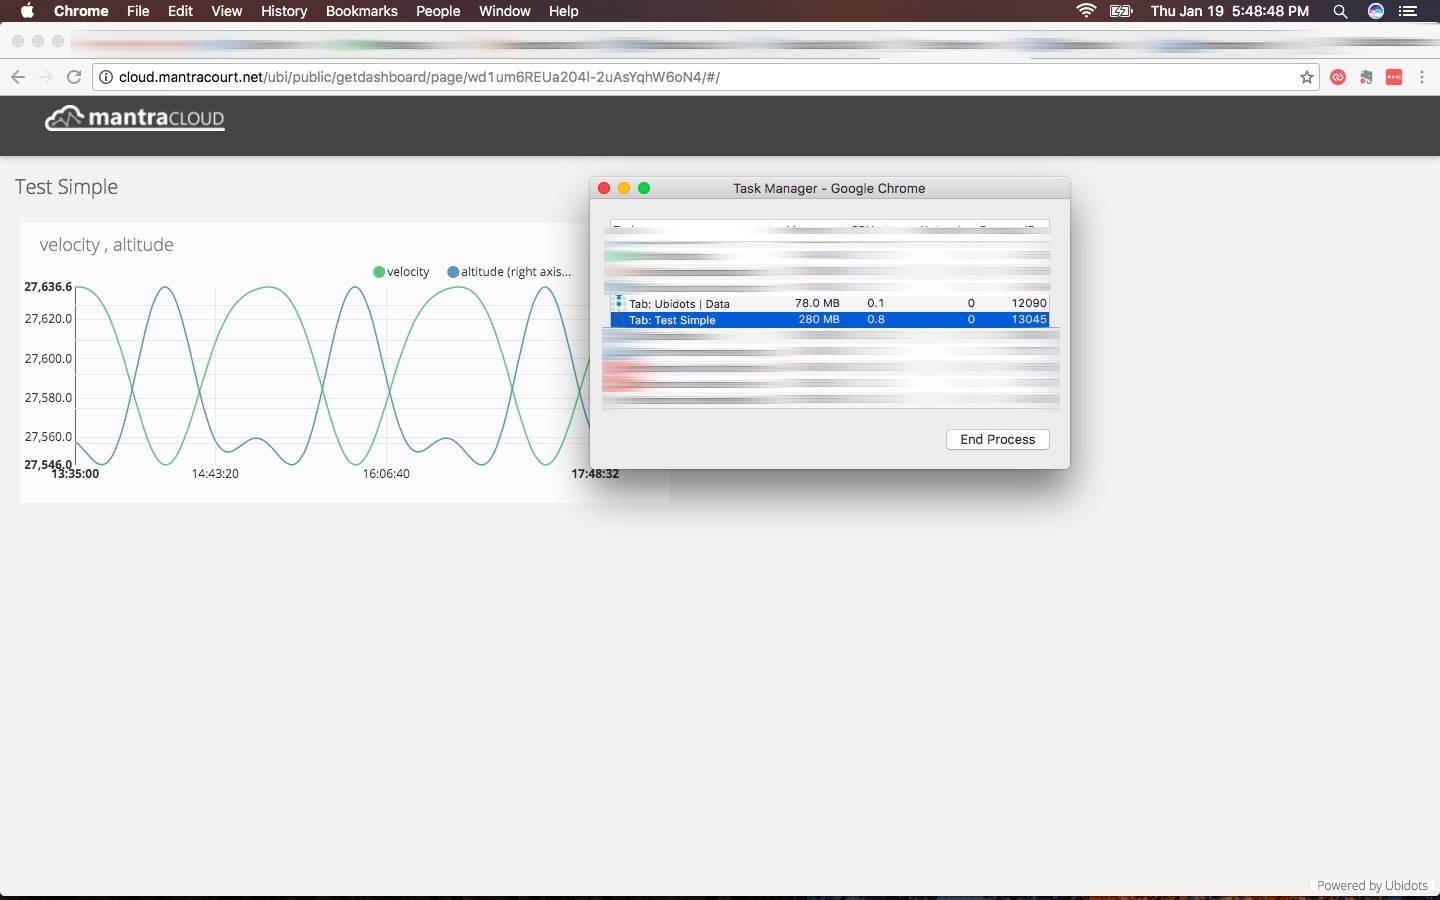
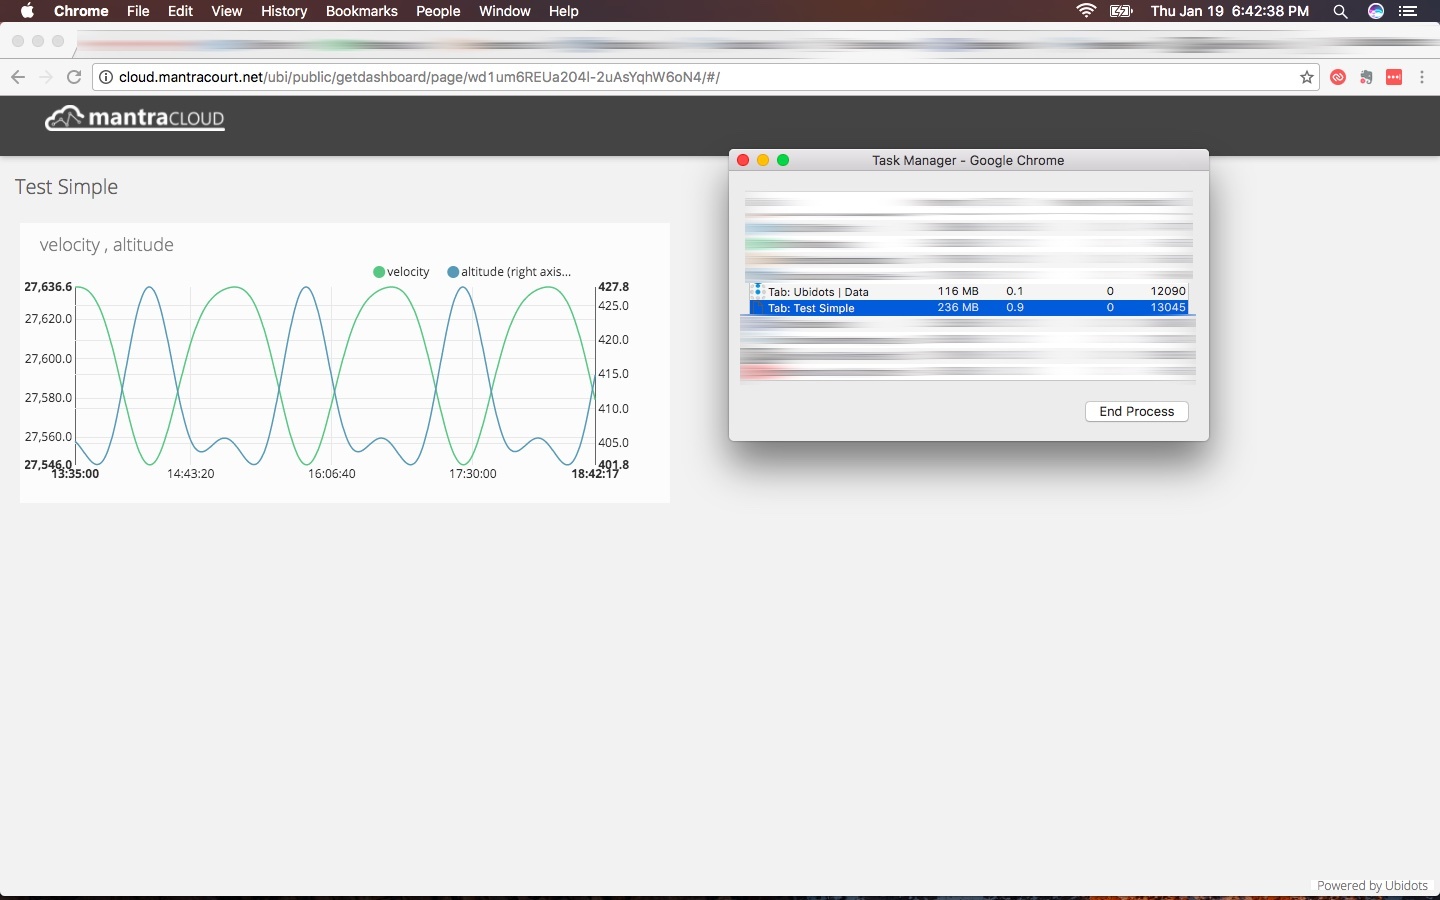
Here are the screenshots I took of Chrome’s Task Manager when opening your widget and the Chrome’s Task Manager before closing the tab.
Start
Final
Thank you!